We explained in this article what we built Quaartz Insights for – now it is time to show you how it works!
Let’s consider the real-life example of one of our customers, a B2B online shop of second-hand kitchen equipment for restaurants. They have a Google Analytics account properly set up with an average daily traffic of 3000 sessions and 5 purchases.
As their various classic online marketing campaigns didn’t work effectively to retarget efficiently the right visitors and increase sales, they decided to use Quaartz Insights.
First, they created an account on https://quaartzinsights.io.
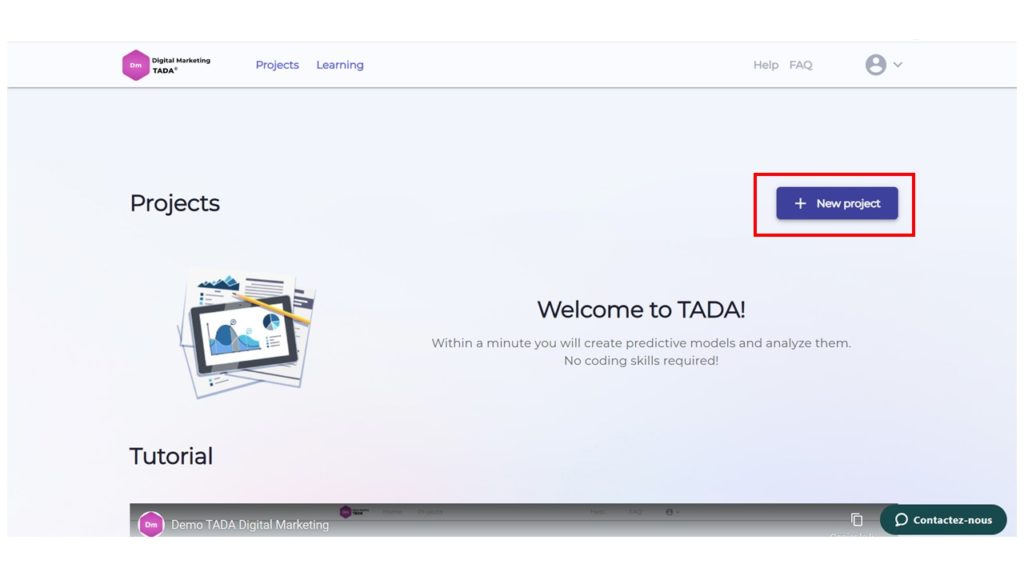
Then, they created their first project:
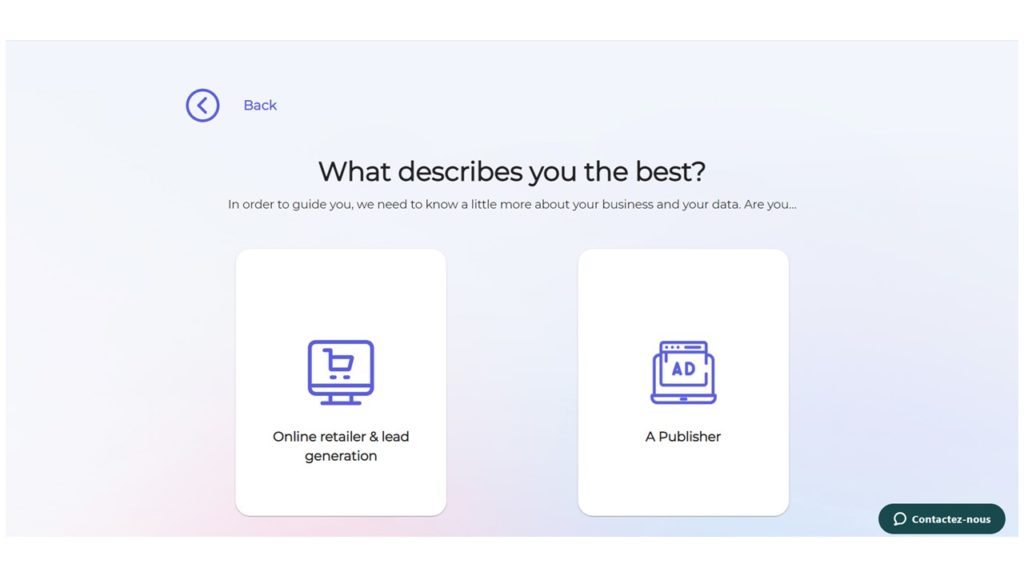
Once they did so, they started detailing their project. As they were looking to increase their sales, they decided to go for the first option and define themselves as an Online retailer.
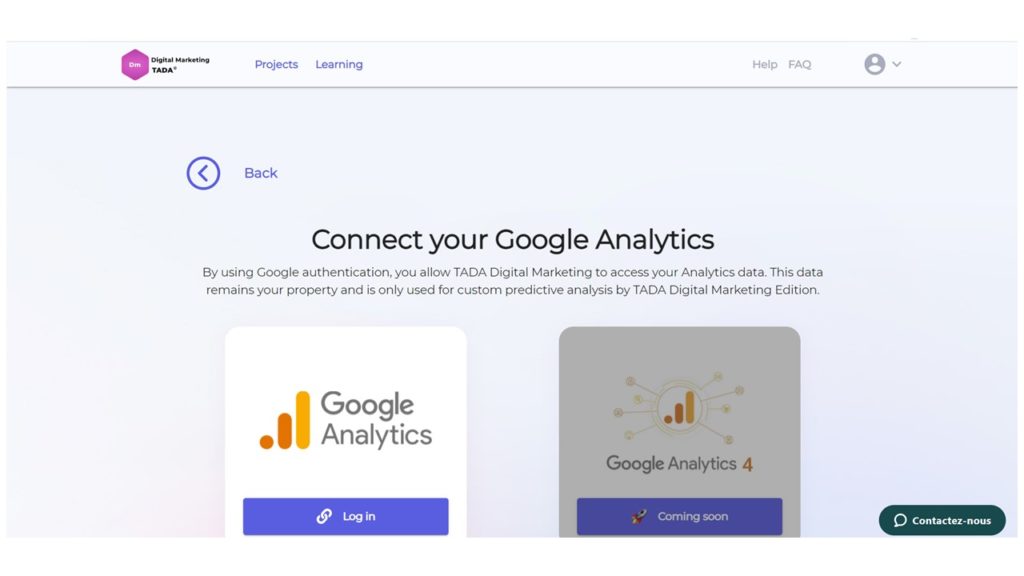
Then, they connected to their Google Analytics user account – they use Google Analytics Universal, which is supported by Quaartz Insights. Google Analytics 4 is coming soon, we’ll keep you updated!
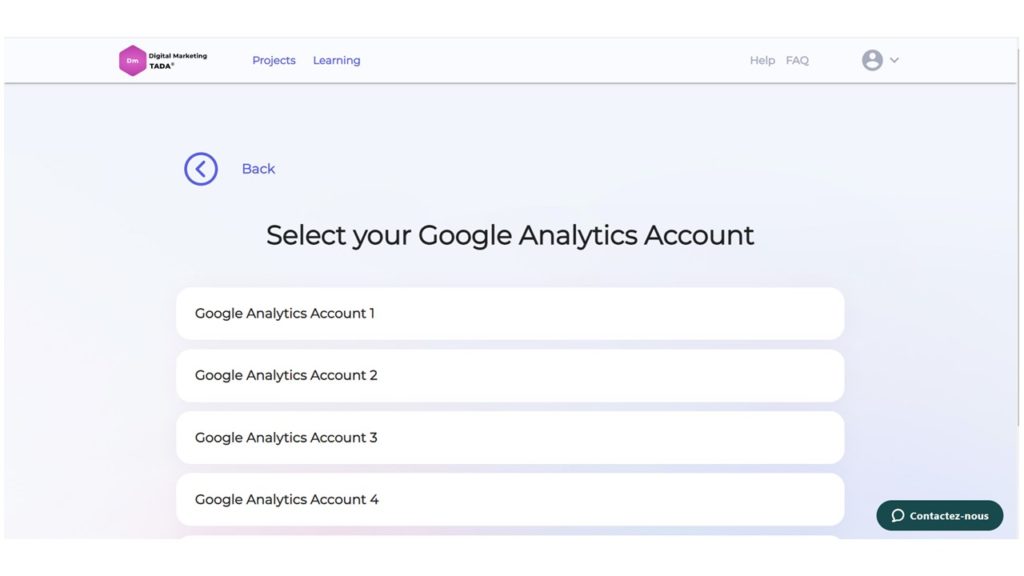
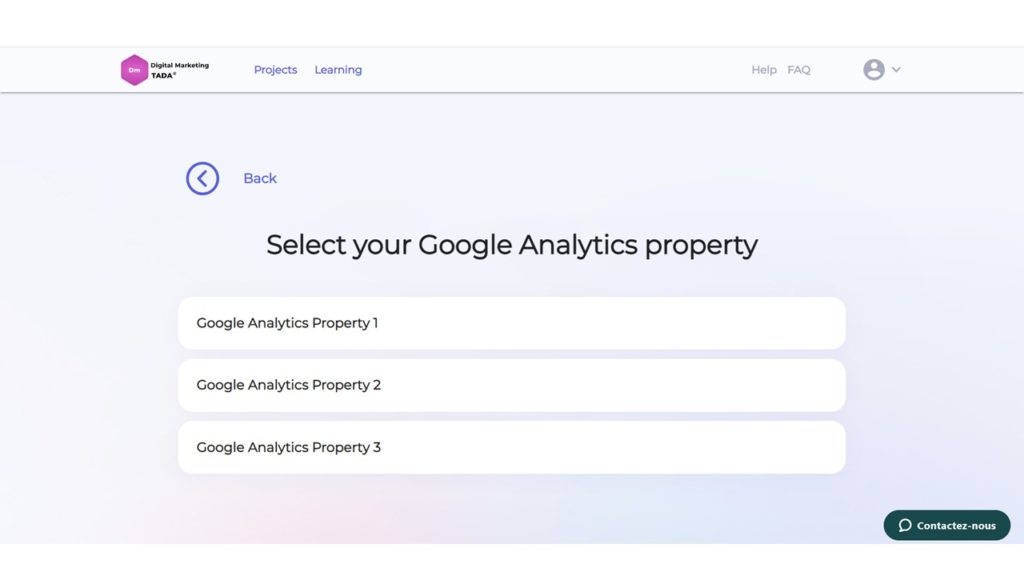
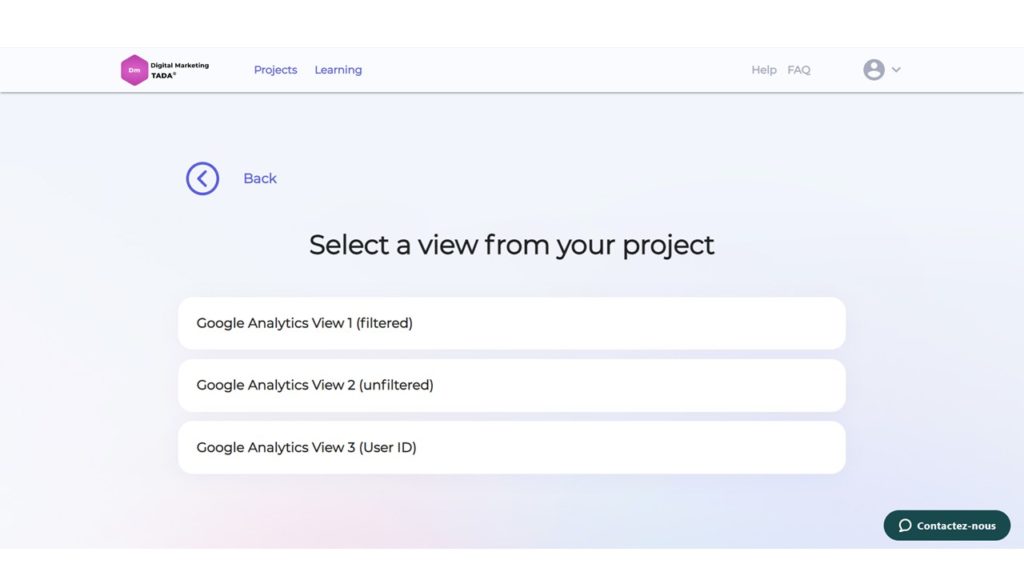
They then chose their Google Analytics account, the property they wanted to work in and the view they wanted to analyze, as shown in the below screenshots. The screenshots have been made anonymous. The “Google Analytics View 1 (filtered)” view was used in this analysis.
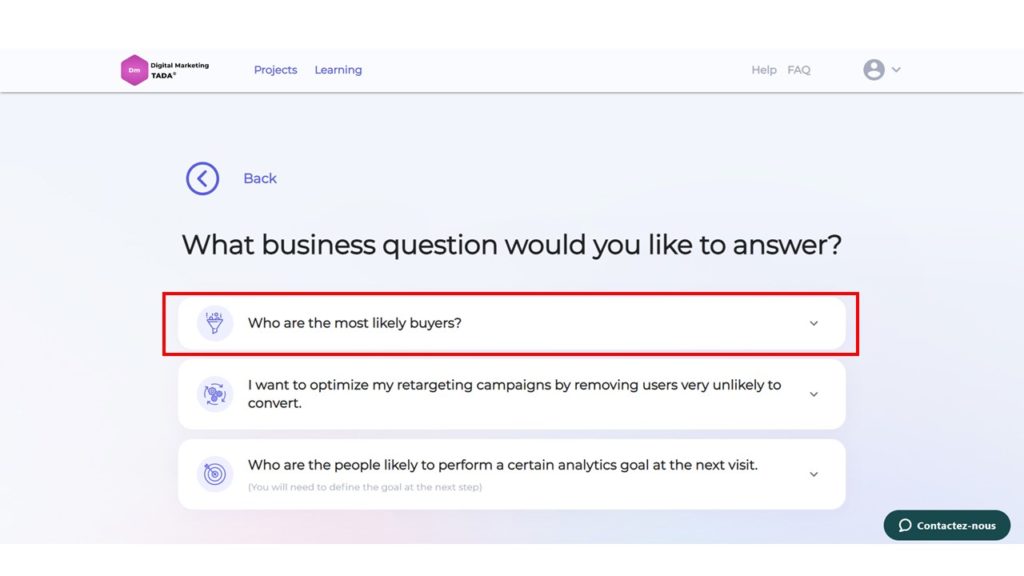
Quaartz Insights users can then precise what business question they want to be answered. In that case, our customer wanted to get insights on which visitors convert to focus its remarketing campaigns on them. Hence, he chose the first option “Who are the most likely buyers?”
They then precise the range of data they wanted to analyze and launched the import:
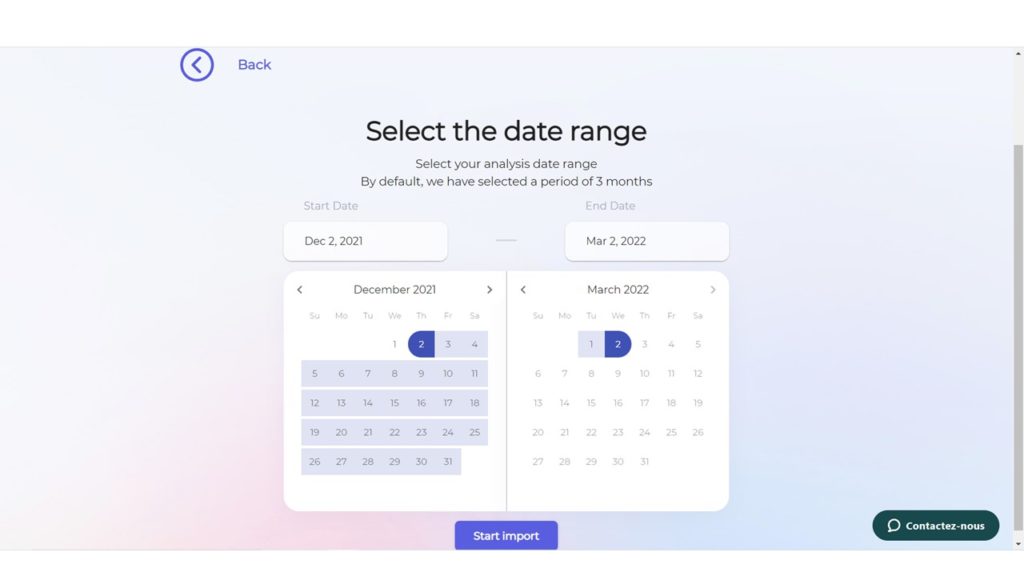
After a few minutes (just enough time to get a coffee), they were able to retrieve 4 Google Analytics metrics that were key to define their audiences:
- the number of pageviews per visitor during the last 3 months;
- What was the source of acquisition of these visitors;
- What device these visitors were using;
- If they did perform at least one event on the website.
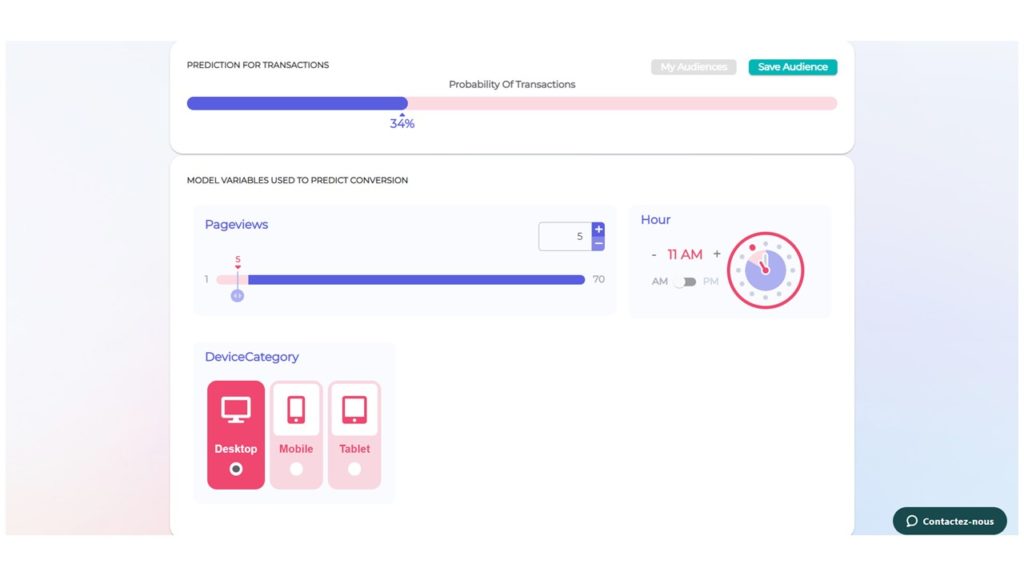
Based on these insights, they were able to simulate different audiences:
In this one, they realized that users who saw only 5 pages on the website would not convert in retargeting between 10 and 12am, whatever the devices they were using. They then decided to stop these campaigns at this time.
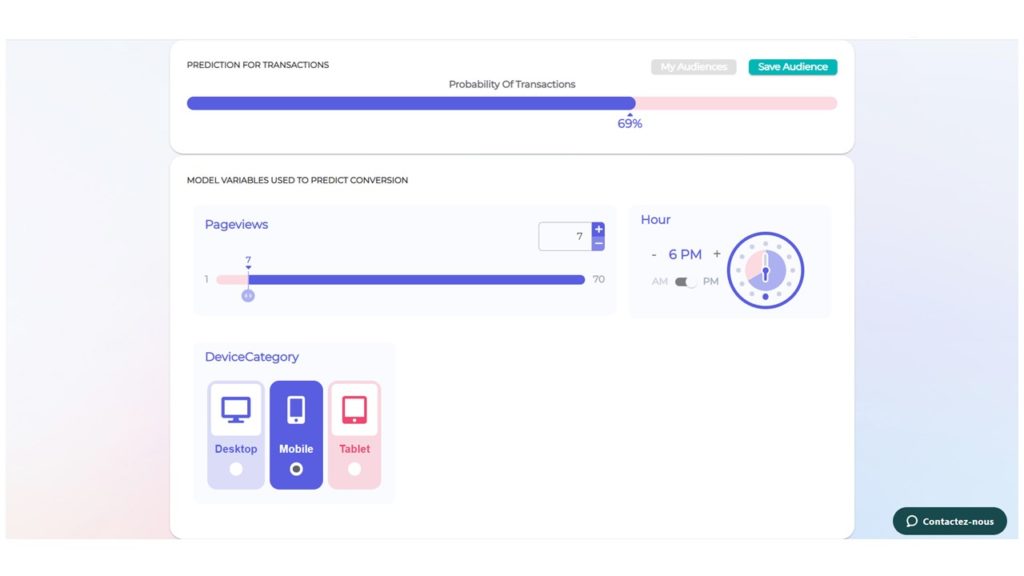
They also realized that people would convert more in the afternoon, but only if they had viewed at least 7 pages on Mobile or desktop. Furthermore, they also discovered that campaigns would be ineffective after 8pm.
Then they were able to save their simulations and export them through Quaartz Insights tutorials.
The results?
After two weeks of retargeting using Quaartz Insights audience insights and with the same budget, they had a daily average of 2000 visits and 20 orders. Of course they attracted less traffic than before for the same budget but traffic is not what matters – orders and conversions are as they generate more sales and increase revenue.
Ready to adapt your marketing strategy and increase your revenue? Then have a look at Quaartz Insights – you can create a 45-day free account here